以 cilium 为例探究 trace 的实现
可调试性
报文转发面组件中,可调试性十分关键。开发阶段可能可以使用 gdb(ebpf 甚至不能用 gdb,只能用 trace_printk),log 等方式进行调试,但到了生产环境,以下几个功能是必须要完备的:
抓包手段
- 按照网卡抓包
- 按照流进行抓包
- 按照特定过滤条件抓包,例如源目的地址,端口,协议号等
报文计数
- 收发包计数:rx,tx 阶段计数
- 丢包计数:按照错误码进行区分
- 特定观测点计数:一些重要转发函数,例如 l3_fwd, arp_response 等
流日志
- 流量方向:egress/ingress
- session 信息:五元组,nat 信息,tcp 状态等
- 其他必要的上下文:例如转发表项查找的结果,构造的 action,硬件卸载标记等
linux perf_events
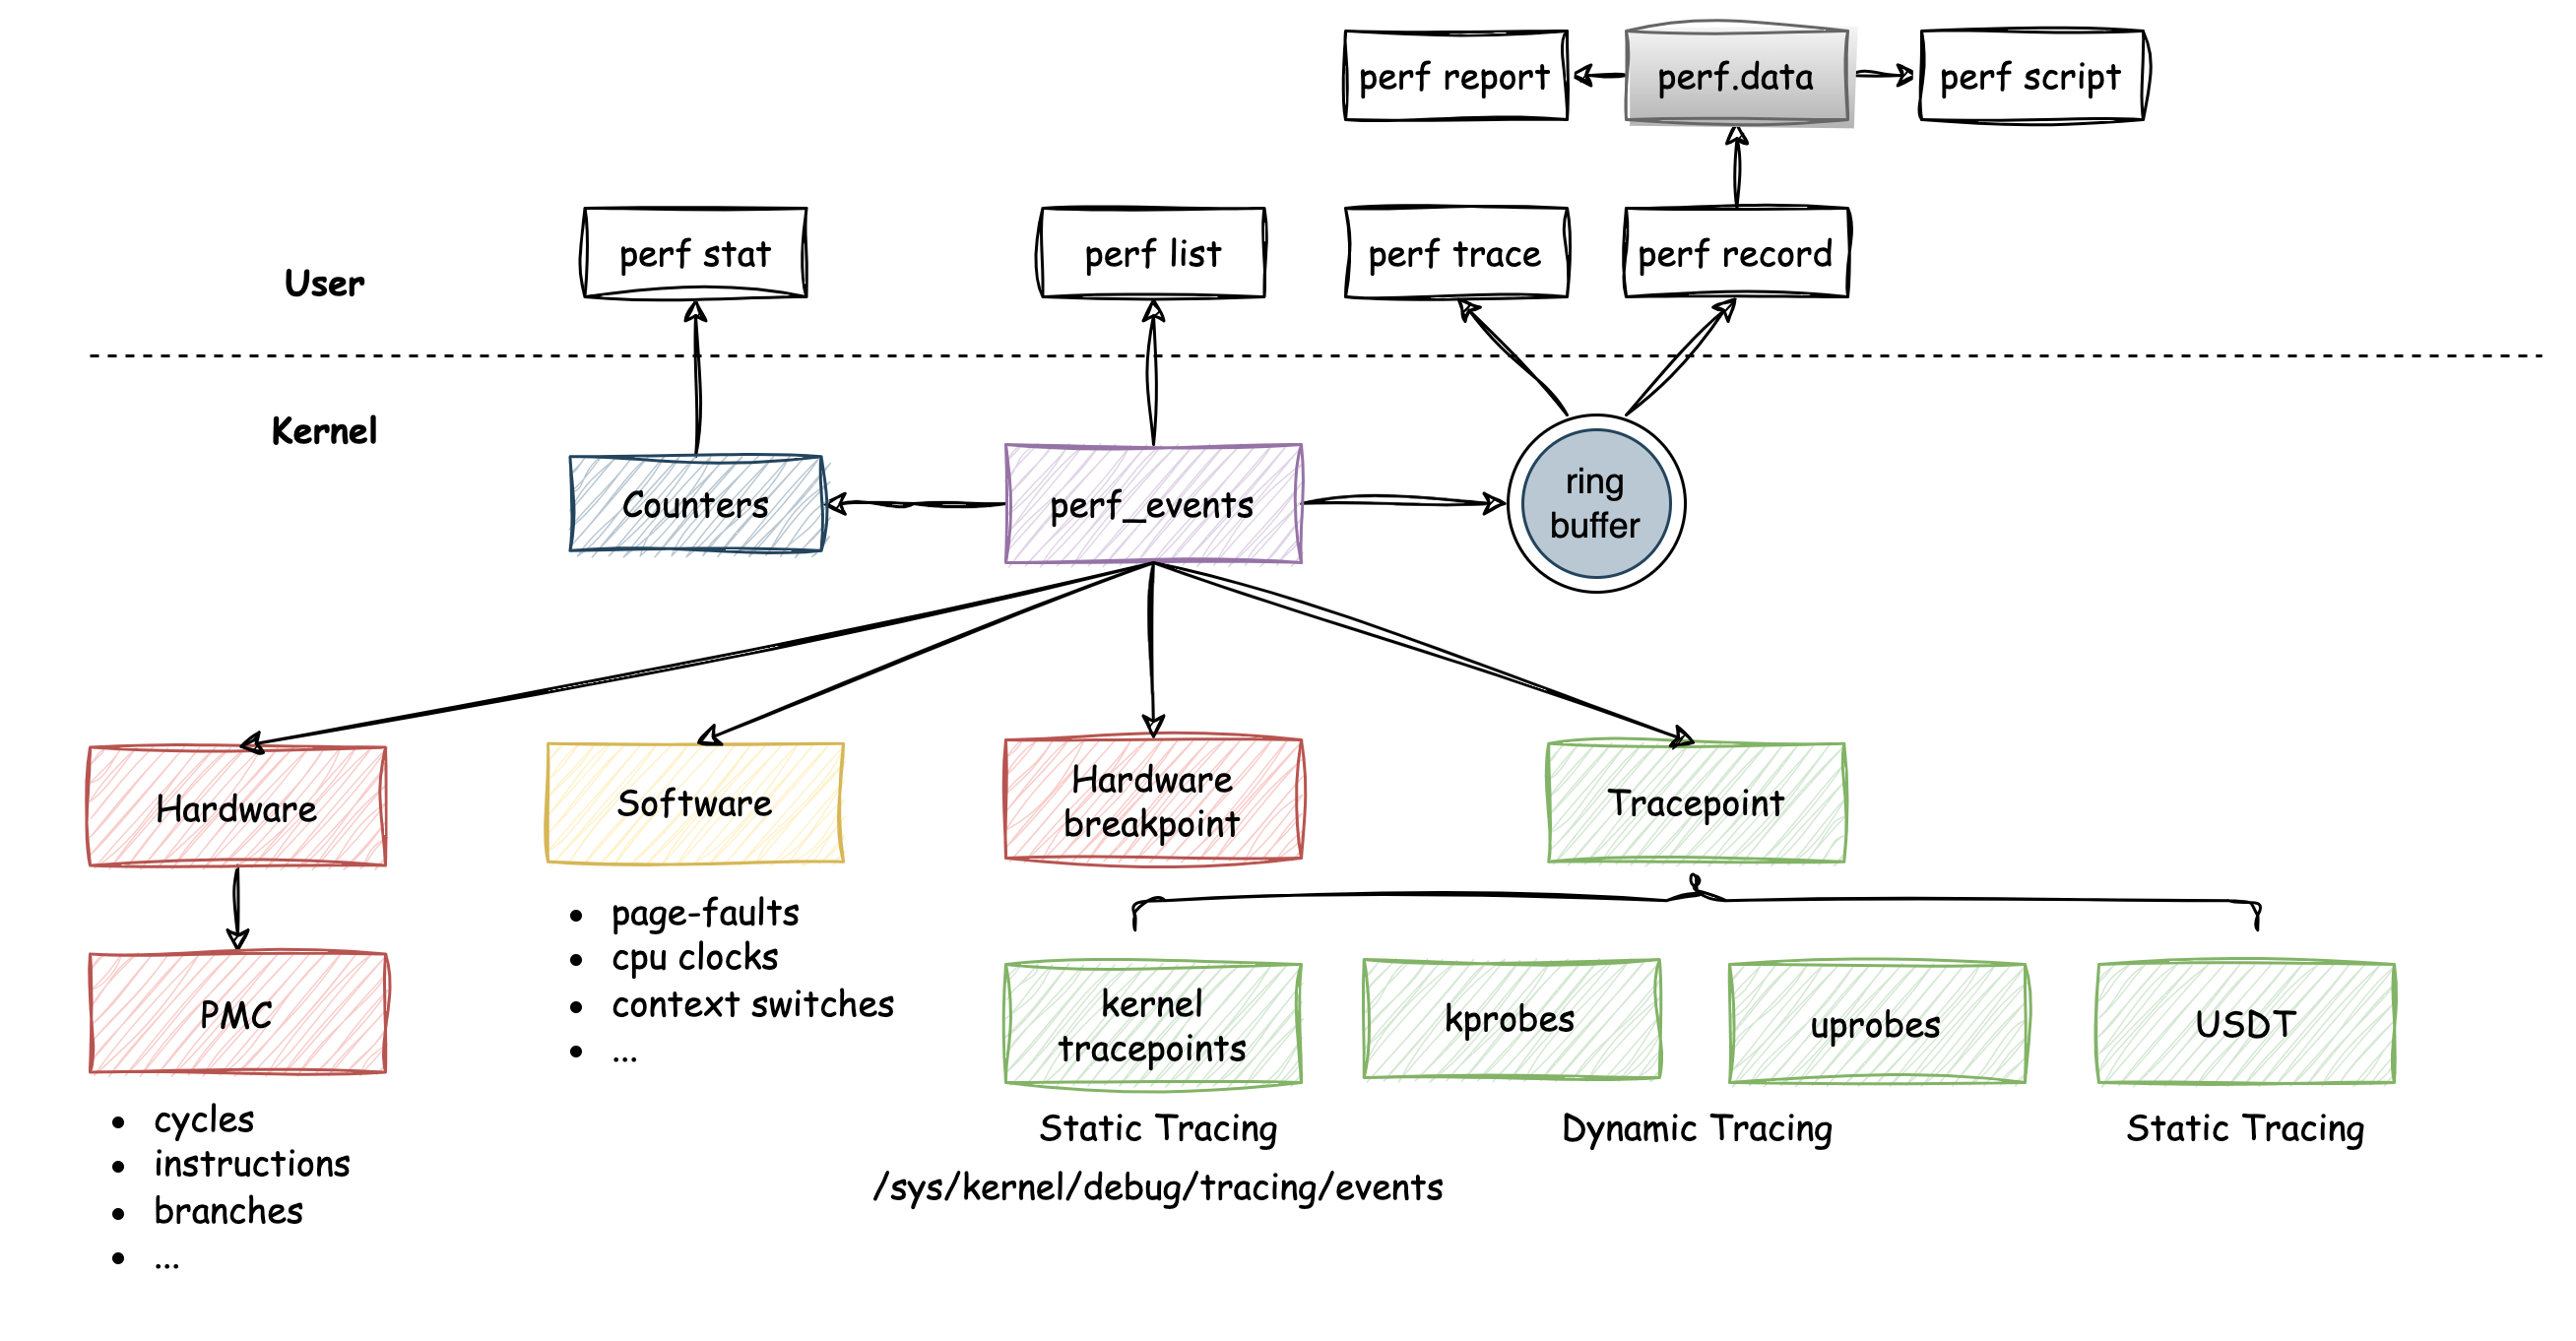
ebpf perf 基于 linux perf_event 子系统。epbf 通知用户态拷贝数据时基于 perf_events 的
perf buffer
ebpf 中提供了内核和用户空间之间高效地交换数据的机制:perf buffer。它是一种 per-cpu 的环形缓冲区,当我们需要将 ebpf 收集到的数据发送到用户空间记录或者处理时,就可以用 perf buffer 来完成。它还有如下特点:
- 能够记录可变长度数据记;
- 能够通过内存映射的方式在用户态读取读取数据,而无需通过系统调用陷入到内核去拷贝数据;
- 实现 epoll 通知机制
因此在 cilium 中,实现上述调试手段的思路,就是在转发面代码中构造相应的 event 到EVENTS_MAP,之后通过别的工具去读取并解析EVENTS_MAP中的数据
EVENTS_MAP 定义如下: bpf/lib/events.h
1 | struct { |
key 是 cpu 的编号,因此大小是 u32;value 一般是文件描述符 fd,关联一个 perf event,因此也是 u32
数据面代码构造好 data 之后,使用 helper function: bpf_perf_event_output通知用户态代码拷贝数据
下面是 cilium 代码中封装好的 event 输出函数,最终就是调用的 bpf_perf_event_output
1 | // bpf/include/bpf/ctx/skb.h |
转发面生成 perf
debug,drop notify,trace 都只是不同的数据格式,最终都是调用ctx_event_output生成 event
数据格式依靠 common header 的 type 进行区分
1 | // bpf/lib/common.h |
subtype,source,hash 这三个字段,不同的 type 有各自不同的用法,后面会提到
Debug 日志
debug 分两种,
- 简单的传参,只传递 2 个或 3 个 u32 到用户态
- 带 capture 的,将整个__ctx_buff 报文带到用户态空间
1 | // bpf/lib/dbg.h |
其中 type(common_header 中的 subtype)定义了用户态代码在解析时的输出格式,由 monitor 进行格式化输出
1 | // pkg/monitor/datapath_debug.go |
Drop notification
drop notification 是一种带了更多信息的 debug capture,数据格式如下
1 | // bpf/lib/drop.h |
文件名和代码行是编译器内置宏输出的
1 | // bpf/lib/source_info.h |
用户态解析时,文件编号需要对应上,可以通过contrib/scripts/check-source-info.sh这个脚本来确保两个文件是对应上的
1 | // pkg/monitor/api/files.go |
相同的,bpf/lib/common.h和pkg/monitor/api/drop.go的错误码也要对应上
trace
数据格式如下
1 | struct trace_notify { |
转发 reason 有以下几种,与 conntrack 状态强相关
1 | // bpf/lib/trace.h |
观测点
1 | // bpf/lib/trace.h |
trace 的观测点是保存在 common header 的 subtype 字段,代码如下
1 |
|
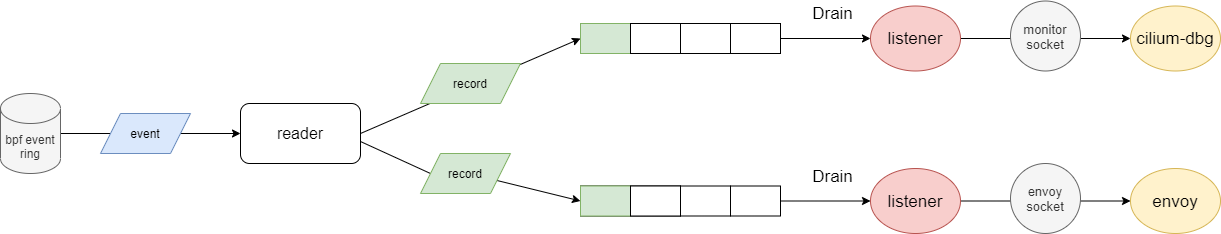
monitor socket
cilium daemon 启动时,会启动 monitor-agent,读取 perf event ring 并提供 api 给 cilium-dbg 工具或 envoy 进行连接
agent 组件
1 | // pkg/monitor/agent/agent.go |
读取 perf ring 流程
1 | func (a *agent) handleEvents(stopCtx context.Context) { |
每个连接的 client 都会创建一个 listener。listener 会分配一个队列。当一个 event 生成后,event 会被广播到所有 listener 的队列中,队列中的 event 会被 listener 消费并发送给 client。发送给 client 的数据都是 raw data,需要 client 自行解析
1 | // listenerv1_2 implements the cilium-node-monitor API protocol compatible with |
具体报文解析代码位于pkg/monitor/format/format.go
perf.Reader 的实现
下面详细展开一下 cilium 对于 perf.Reader 的实现
主要流程:
- 为每个 cpu 创建 perf event
- perf event 的 fd 做 mmap 映射,拿到内存地址
- fd 加到 epoll
- 启动 readInto,大部分时候 epoll wait 等待,直到有 epoll 事件时从 ring 中读取 event
1 | func NewReaderWithOptions(array *ebpf.Map, perCPUBuffer int, opts ReaderOptions) (pr *Reader, err error) { |
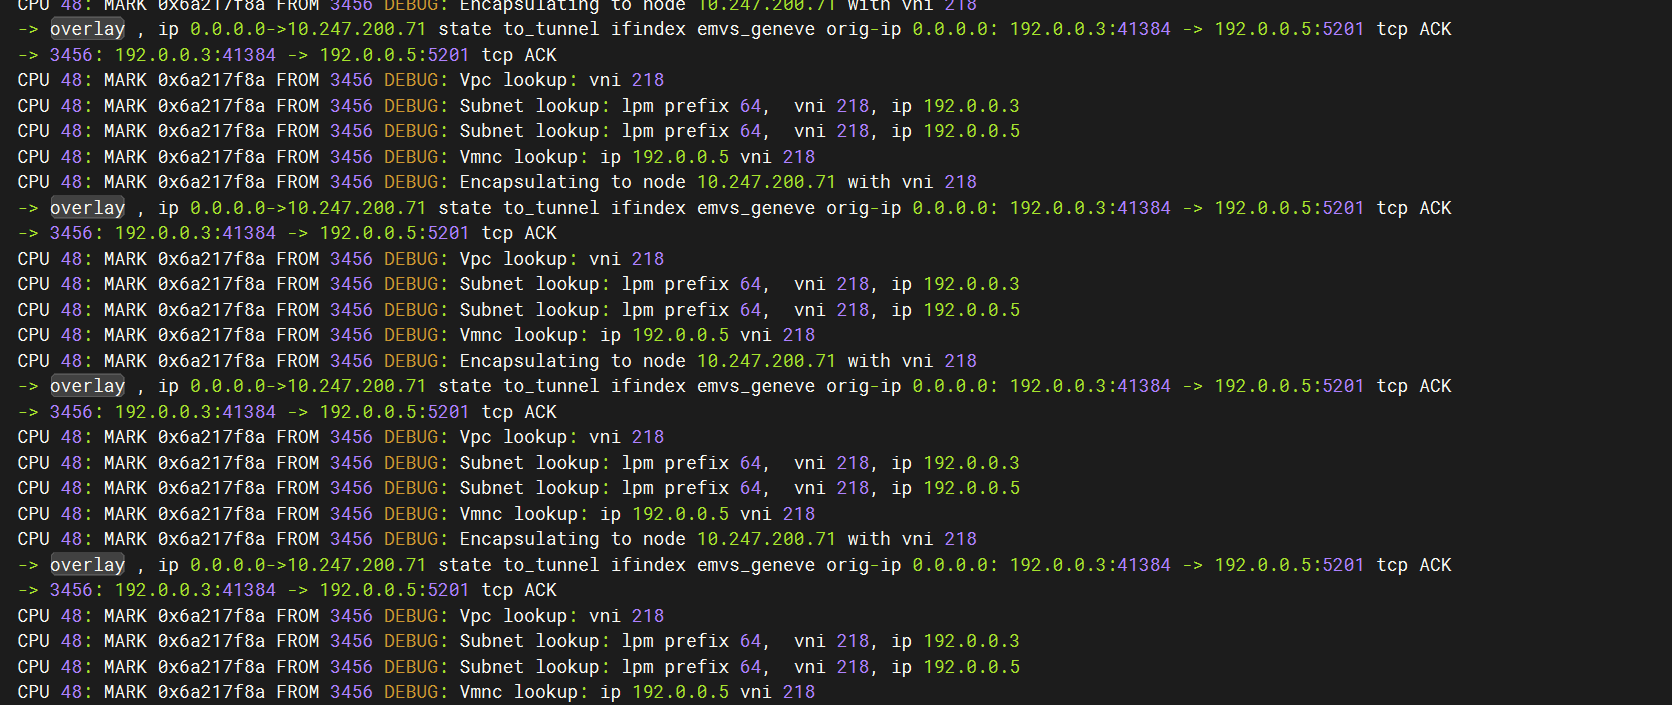
monitor 样例输出
本人开发的基于 cilium 的魔改版本 😉(实现基本的 vpc 功能)